
Flooding
Flood Monitoring
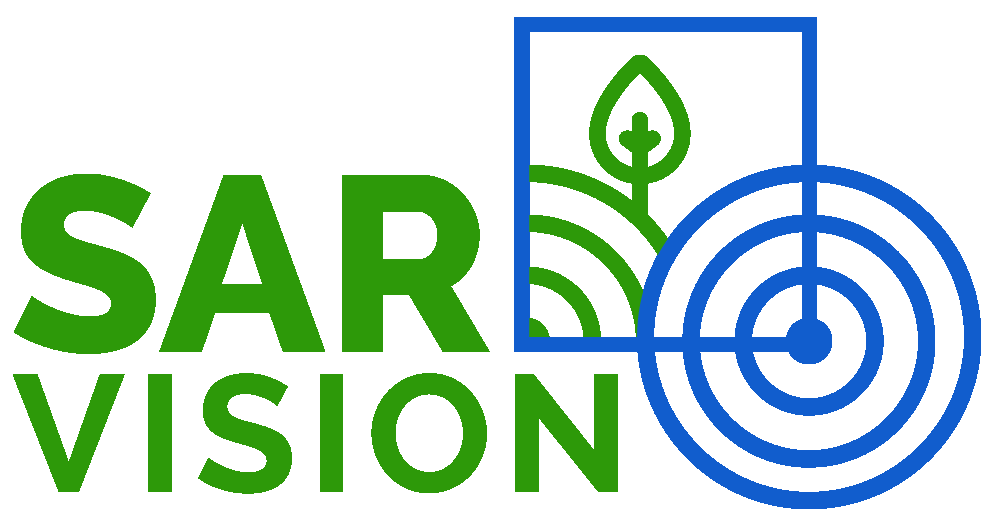
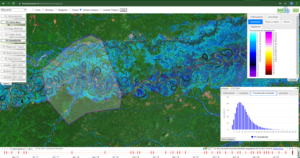
Semi-automated algorithms are used to create consistent time-series of flooding and water extent. With this system, flood frequency and -duration maps are made based on a combination of Sentinel-1 and PALSAR-2 radar images. Note that flooding is also mapped under the tree canopy!
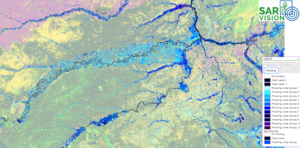
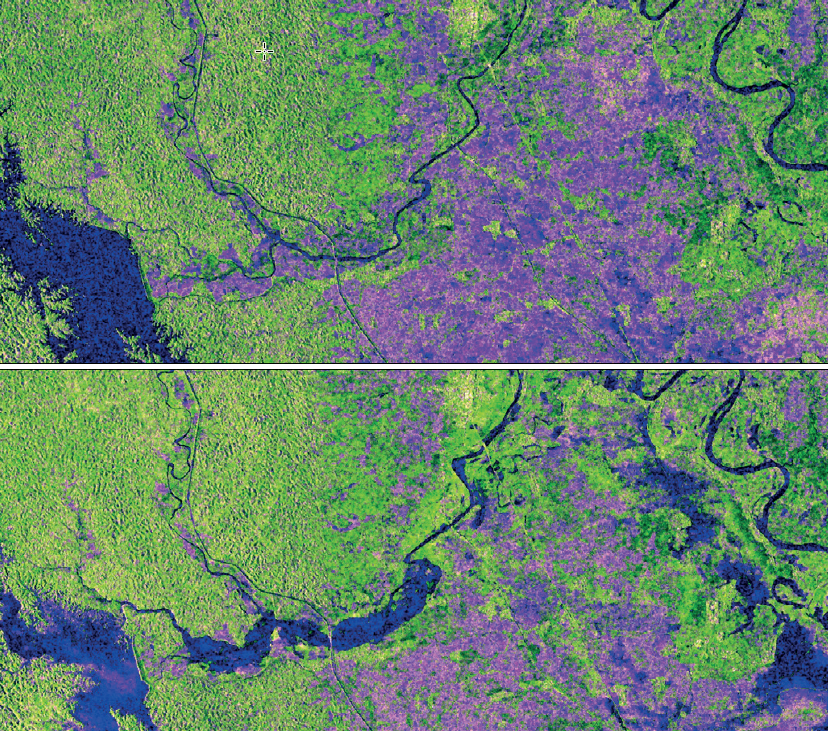
Flooding in Guaviare river Colombia 2007-2017. The flooding patterns related to different vegetation types provide new hydrological and ecological information that can be used for mapping wetland types.
Rapid Hazard Assessment
SarVision is able to carry out a quick assessment of the impact and extent of unexpted floods, storm damage, forest fires and other catastrophes within a few days after they occur. During such events clouds and smoke often prevent a rapid analysis with optical images, but radar is not affected. The damage of forest fires can be quantified with our radar monitoring systems.
radar monitoring systems. Not only fast, but also providing information on the degradation level.
SarVision also carries out flood analysis for private companies. For instance to ascertain that expansion of e.g. plantations, buildings, solar panels etc. is not being threatened by potential floods in the near future.